
The need for sustainability reporting is increasing worldwide.
According to Ernst & Young, there are over 600 variations on how organizations report on sustainability efforts worldwide. Major environmental initiatives such as the Climate Pledge and the recent COP26 conference are driving greater demand for accountability and thus reporting on overall progress towards goals. But the availability and scope of the tools necessary to create and share organizational ESG status are insufficient.
Sustainability and energy reporting are still manual and time-intensive processes.
Company leaders who haven’t automated specific functions still struggle with tracking, measuring, and reporting ESG goals. Converting data access, management, and quality control from manual to automatic processes returns valuable time to facility teams. With these newly available hours, energy leaders can focus on adapting, achieving, and elevating their organizational sustainability outcomes. Reaching local and regional milestones is crucial to affecting positive climate change globally.
As part of our global expansion, we’re excited to announce Atrius is now available across Europe. This highly customizable solution streamlines access to energy data, automates manual reporting processes, and elevates visibility into overall building performance. Designed to optimize productivity, Atrius enables facility teams with more time to focus on hitting their most ambitious sustainability goals.
Centralized and automated reporting
The data management challenges facing today’s energy teams aren’t new, and the spreadsheet solution is inefficient. The labor-intensive task of manually completing spreadsheets stems from an unresolved, long-term problem: accessing and managing crucial information dispersed across multiple systems.
Facility teams spend an excessive amount of time normalizing and reporting on metrics related to energy reduction targets like emissions tracking, total energy usage, and capital projects investments. Consequently, they’re often left with less time to gather insights from their data and develop new strategies to reach their goals.
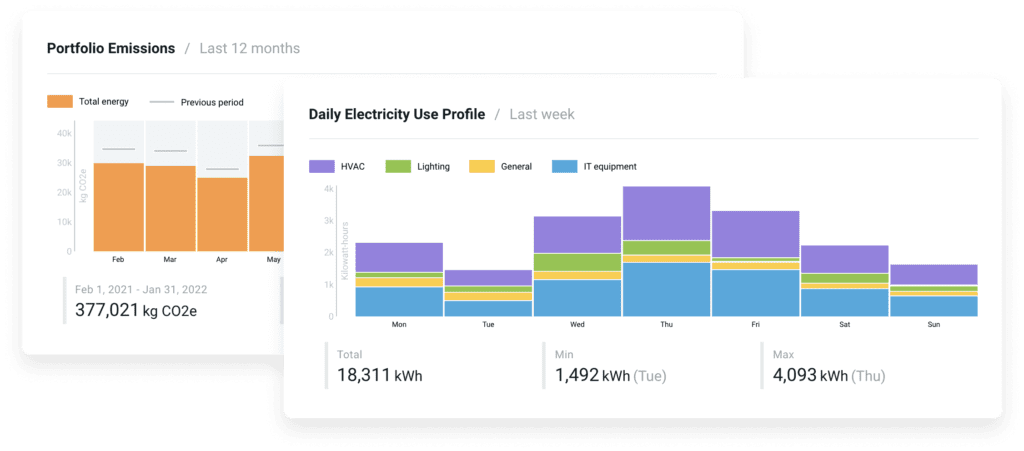
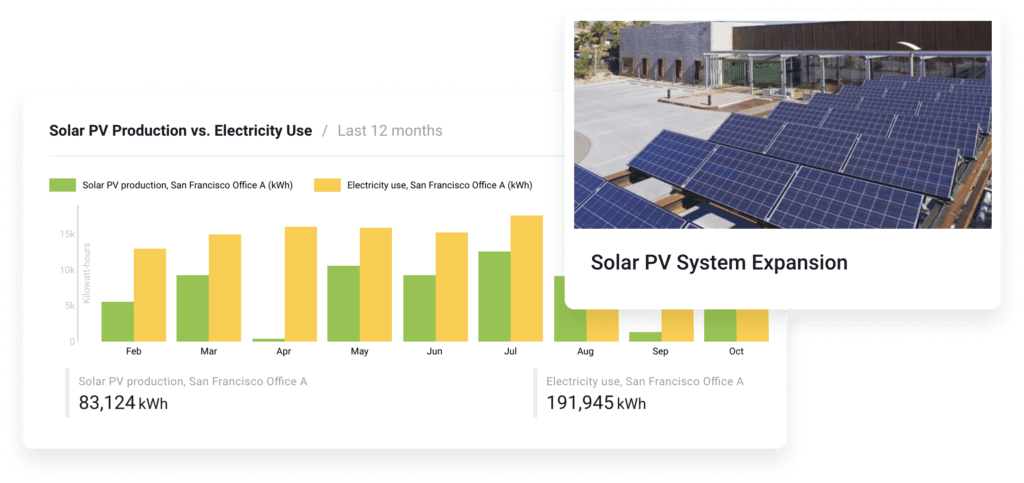
The reporting features in Atrius centralize facility information collected from on-site hardware and systems into a single, easy-to-access cloud-based software solution. Atrius provides self-service analytic capabilities to easily create exportable reports that can also be displayed in public-facing dashboards.
Frequently created Atrius reports include:
- Energy usage across a single building or portfolio
- Daily profile or breakdown-of-end-use (HVAC/lighting/plug loads)
- Side-by-side comparison of portfolio buildings
- Current utility bill costs compared to previous years
- Greenhouse gas emissions against a set goal
Elevate your sustainability story
Accurate energy reporting and visibility help meet reduction goals at every organizational level and solidify these ESG targets as part of company culture.
Groups across an organization can showcase progress towards their sustainability targets with the visually intuitive Atrius’ Storyboards feature. Reports built-in dashboards can drive multi-chapter storyboards that provide more context to corporate-level initiatives.
Storyboards enable the gamification of energy outcomes, driving higher-user engagement towards goals and spotlighting progress across different teams, floors, or buildings.
Real-time visibility into energy performance
Staying aware of all the various systems and set schedules in your building or portfolio is tough. Add in time zone differences, and the task of identifying excessive or unoptimized energy is more challenging. Often these charges are posted to the utility invoice before energy managers know about the variances. That’s why Atrius has alerts built directly into the application.
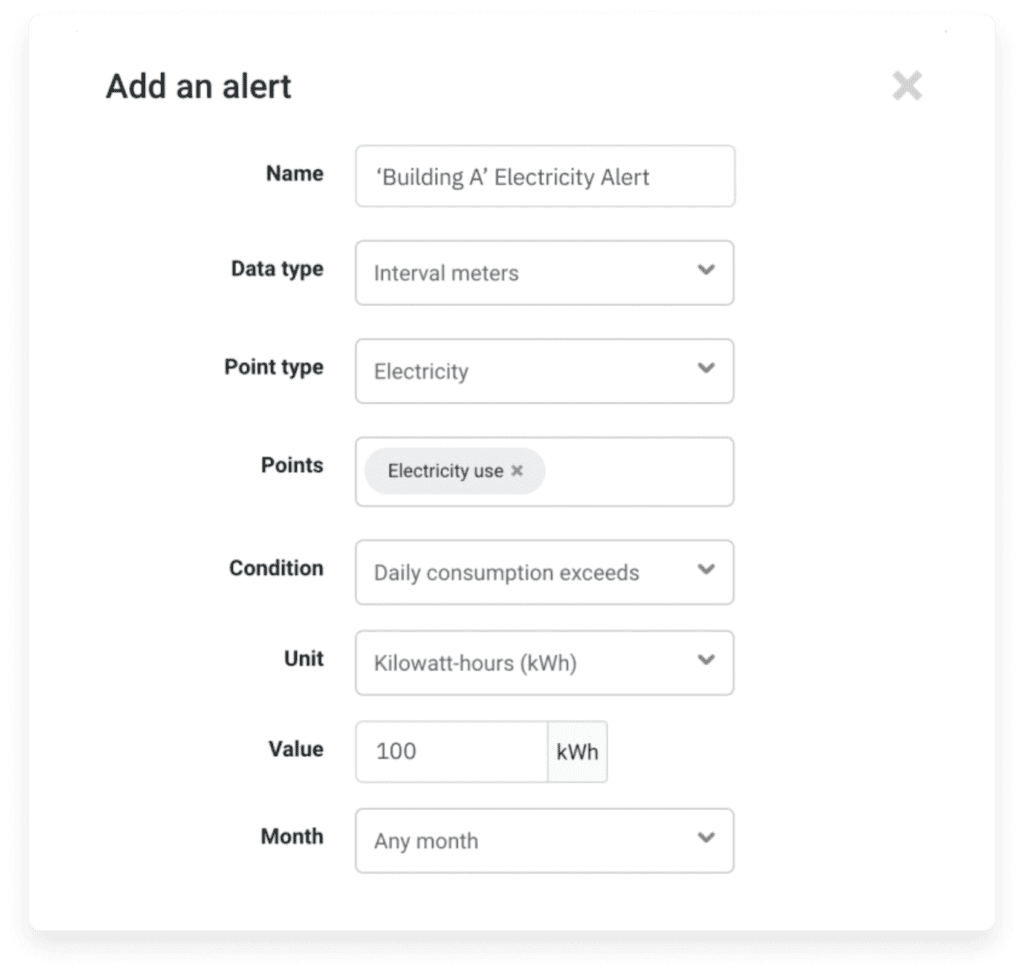
Rather than discovering a building schedule is incorrect at the end of a billing cycle, Atrius Energy alerts users instantly when a predetermined condition is met. As a result, users can take immediate corrective action.
Our goal is that organizations’ energy leaders can use Atrius to reach their most ambitious sustainability goals by enabling better access to their data. As sustainability mandates continue to increase worldwide, we’re excited about adding more features for our global customers to help them gain a bird’s eye view of all their buildings.
Today customers in France, Germany, Ireland, Norway, Spain, and the United Kingdom are taking full advantage of Atrius Energy and Sustainability capabilities including:
- The ability to integrate with local utility providers
- Personalize the language within our platform
- Display currency and costs in your local unit
- Specify metric or imperial as a unit of measurement
The future of creating greener spaces
Energy reduction targets are achievable when energy leaders can better sense and track the data in their spaces. Rather than relying on manual spreadsheets or outdated utility data, teams centralizing data and automating reports have the resources to achieve and surpass their most ambitious sustainability goals.
With a comprehensive view of how their buildings are performing globally, facility teams can take meaningful action towards making their spaces smarter, safer, and greener.
Check out the video below to see what’s new in Atrius today: