


This paper investigates variation in spoken language across seven generations of English speakers in the southern US state of Georgia. As in many areas of the United States, rapid demographic shifts during the late twentieth century have contributed to increased urbanization and diversity, particularly in the Atlanta metropolitan area. These developments are accompanied by linguistic changes, detectable in speakers’ vowel systems, characterized most straightforwardly as a preference by younger speakers for supralocal patterns like the Low-Back-Merger Shift (LBMS; Becker, Reference Becker2019), rather than regionalized configurations. Although young speakers in many parts of the United States participate in the LBMS, the chronology and motivation for change are less understood. However, a recent investigation in Lansing, Michigan, where the Northern Cities Shift has declined, highlighted the generational divide between Baby Boomers and Generation X as “a pivotal transition throughout the country” (Nesbitt, Reference Nesbitt2021:359), and the panregional arrival of the LBMS is a possible source for Nesbitt's strong generational claim. We test this hypothesis among White speakers from Georgia, where older speech patterns include the Southern Vowel Shift (SVS; Labov, Reference Labov1991; Labov, Ash, & Boberg, Reference Labov, Ash and Boberg2006). Like Nesbitt, we analyze White speakers, as we do not necessarily expect other ethnic groups’ speech patterns to show the same vowel configurations or to be driven by the same factors (see Farrington, King, & Kohn, Reference Farrington, King and Kohn2021; Thomas, Reference Thomas2007, for Black speakers; and Renwick, Forrest, Glass, & Stanley, Reference Renwick, Forrest, Glass and Stanley2022, for Black speakers from Georgia). Broadly, we hypothesize that the SVS peaked among members of the Baby Boomer generation, and that rapid change away from the SVS began in Generation X, with adoption of the LBMS among the youngest speakers.
Classic descriptions of the SVS as a phonological system are predominantly based on speakers from the Baby Boomer generation and the preceding (demographically smaller) Silent Generation. Labov (Reference Labov1991) provided vowel spaces for Jerry Thrasher, a twenty-year-old from Leakey, Texas—likely a Baby BoomerFootnote 1—and Monnie O'Neil, a thirty-one-year-old from Wanchese, North Carolina (a Silent Generation speaker, born 1938). Similarly, in an earlier characterization of the SVS, Labov, Yaeger, and Steiner (Reference Labov, Yaeger and Steiner1972) argued that “younger” Atlanta speakers exhibited strong shifting. Among participants in the Telsur project that provided data for the Atlas of North American English (ANAE), the most speakers representing the US South were in their forties (approx. 26%; Labov et al., Reference Labov, Ash and Boberg2006:Figure 4.1). Since Telsur was recorded in the mid-1990s, those speakers were Baby Boomers; thus, that generation is heavily represented in ANAE's linguistic descriptions.
Despite the long history of the SVS, the ANAE found that the shift was less robust among younger speakers (Labov et al., Reference Labov, Ash and Boberg2006:251, 253), a trend confirmed in more recent studies. Work focused on Raleigh, North Carolina, shows that the SVS has “retreated” in recent decades (Bissell, Reference Bissell2023; Dodsworth & Benton, Reference Dodsworth and Benton2017; Dodsworth & Kohn, Reference Dodsworth and Kohn2012). Dodsworth and Kohn's (Reference Dodsworth and Kohn2012) apparent-time analysis indicated that the period of most rapid change occurred among speakers born 1955-1978, including Baby Boomers and Generation X, while younger speakers who grew up in the new suburbanized environment exhibited fewer SVS characteristics. Instead, younger speakers’ vowels—including retracted lax kit, dress, and trap—more closely resembled the LBMS.
Descriptions of the SVS, LBMS, and most other major regional varieties of the United States have typically depended on acoustic measurements of vowels extracted near the vowel's nucleus or midpoint. However, particularly for the SVS, vowel dynamics are also crucial diagnostics. Some vowels implicated in the SVS (e.g., price and face) are diphthongal in most English varieties, while lax kit, dress, trap may all become more diphthongal in the SVS. We therefore analyze vowel trajectories, via Generalized Additive Mixed Models (GAMMs; Wood, Reference Wood2017a). The hypothesis investigated by our GAMMs is that speaker year of birth significantly affects vowel trajectory shape. To evaluate the specific hypothesis that Baby Boomers represent a “peak” in adherence to the SVS, we also carry out linear mixed-effects modeling on single-point values representing a token's placement along the front-vowel diagonal (see Dodsworth & Benton, Reference Dodsworth and Benton2017; Labov, Rosenfelder, & Fruehwald, Reference Labov, Rosenfelder and Fruehwald2013). GAMMs and linear modeling provide evidence of a gradual increase in SVS features, albeit at differing rates, through the Baby Boomer generation, followed by a rapid shift toward the LBMS in younger speakers. This paper thus adds a new location where regional varieties have dissipated among younger speakers: Georgia. The remaining sections provide background on the vowel systems under investigation, focusing on Georgia; details of our data and methods; and results of nonlinear and linear modeling. We conclude by discussing the wider implications of our results for analysis of regional and panregional sound changes.
Relevant vowel shifts
Over the past century, multiple vowel shifts have been attested in Georgia. We first describe the Southern Vowel Shift and the Low-Back-Merger Shift. These shifts implicate some of the same vowels, and we discuss both overall structure and proposed stages of change. Second, we situate these shifts within the body of sociolinguistic research in Georgia, paying special attention to the approximate generation of speakers analyzed. Since we expect Baby Boomers to be a pivot point, we group the literature into sections covering speakers before, during, and after the Baby Boomer generation.
Southern Vowel Shift (SVS)
The SVS (Figure 1, left panel) is a regional vowel shift first identified in the US South (Bailey, Reference Bailey and Schneider1997; Labov, Reference Labov1991:19; Sledd, Reference Sledd1966) which varies widely in implementation. Some researchers consider the SVS to include vowels throughout the space (Fridland, Reference Fridland2012; Stanley, Renwick, Kuiper, & Olsen, Reference Stanley, Renwick, Margaret E. L., Ireland and Olsen2021), but we focus on the front vowels, which have received the most attention in recent literature (e.g., Dodsworth & Kohn, Reference Dodsworth and Kohn2012; Farrington, Kendall, & Fridland, Reference Farrington, Kendall and Fridland2018). Movement of front vowels in the SVS is proposed to occur in three stages (Farrington et al., Reference Farrington, Kendall and Fridland2018; Fridland, Reference Fridland2012). In the first stage, the price vowel monophthongizes and its nucleus fronts toward [a:], sometimes only in pre-voiced or word-final contexts (referred to herein as the allophones prize, pry). Second, the nucleus of face lowers and retracts while the nucleus of dress raises and fronts, and both vowels become more diphthongal. In the third and final stage, fleece lowers and backs, while kit fronts and raises. The third stage of change involving the high-front vowels is not as widespread as the first two stages, even in core areas of the South (Labov et al., Reference Labov, Ash and Boberg2006). trap is also raised in speakers with some stages of the SVS (Dodsworth & Kohn, Reference Dodsworth and Kohn2012; Koops, Reference Koops2014), but the timing of trap-raising within the shift is less clearly articulated in the literature. The distribution of raised trap suggests that it occurs at some point between the monophthongization of price and completion of the face/dress “reversal.”
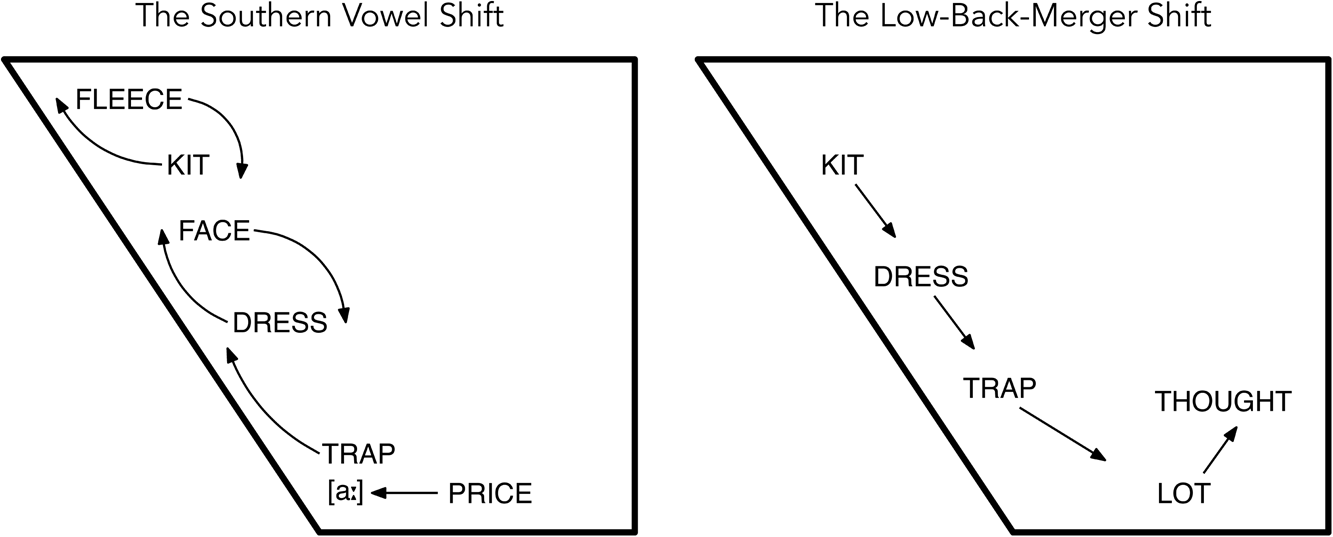
Figure 1. Representations of changes in the nuclei for the Southern Vowel Shift and the Low-Back-Merger Shift (excluding back vowel shifts). Adapted from Labov et al. (Reference Labov, Ash and Boberg2006:244) and Becker (Reference Becker2019:3).
Low-Back-Merger Shift (LBMS)
The LBMS (Figure 1, right panel) is an ongoing panregional vowel shift identified across multiple areas of the United States and Canada (Becker, Reference Becker2019; Boberg, Reference Boberg and Becker2019; Eckert, Reference Eckert2008). The proposed genesis of the shift is the merging of the low back vowels lot and thought (Becker, Reference Becker2019; though see Gardner & Roeder [Reference Gardner and Roeder2022] for an alternative proposal), which is either in process or has reached completion for many English speakers across North America (Labov et al., Reference Labov, Ash and Boberg2006). After the low-back merger, the lax vowels lower along the front diagonal of the vowel space, in sequence: first trap, then dress, and kit. The LBMS tends to be observed in younger speakers, and the earlier stages (e.g., trap-backing) are more common than later-stage changes (Fridland & Kendall, Reference Fridland, Kendall and Becker2019; Nesbitt, Wagner, & Mason, Reference Nesbitt, Wagner, Mason and Becker2019).
An important element of the LBMS for our analysis is that its vowel movements run opposite to those expected within the SVS. Specifically, trap, dress, and kit should raise and front in the SVS, but they lower and retract for the LBMS. The diametrically opposed movements of these shifts make it theoretically difficult to identify a dividing line between the loss of the SVS and the genesis of the LBMS for the front lax vowels, to say nothing of speakers’ perceptions of these phonetic differences. We use “loss of the SVS” or similar when speakers move from a clearly raised and fronted position for the front lax vowels to a position lower along the front diagonal over time. We use “adopting the LBMS” or similar only if there is lowering of the lax vowels as they relate to the position of the face vowel, particularly if there is clear retraction of trap from the front low position.
Generational theory
Before discussing language change over time in Georgia, we briefly describe our study's demographic framework of generational cohorts. A generational cohort, defined by a range of birth years, groups people by age to capture the major events and techno-social changes that may shape their collective experience. Defining a generation is imprecise because those born near boundaries may have characteristics of either generation and because not everyone within an age range shares the same experiences and behavior. Nevertheless, we suggest that shared behaviors may extend to language. Some language changes may advance stepwise through generations rather than continuously through birth years.
The generational cohorts relevant for this study are defined using Strauss and Howe (Reference Strauss and Howe1991) and the Pew Research Center (Dimock, Reference Dimock2018; Pew Research Center, 2015). The Lost Generation, born 1883-1900, experienced the Great Depression and World War II in midlife. The G.I. Generation, born 1901-1924, were children or young adults during the Great Depression and the largest group of soldiers in World War II; they are often called the Greatest Generation. The Silent Generation, born 1925-1942, so called due to their conformist and civic-minded behavior, experienced the Great Depression and World War II as youth. The Baby Boomer generation, born 1943-1964, is defined as those born during the Baby Boom, a period of high birth rates in the postwar era. “Boomers” came of age in the counterculture movement of the 1960s and were most affected by the Vietnam War. Enrollment in higher education and urbanization began in earnest among Boomers. The Baby Boomer generation has, until recently, constituted the largest share of the adult population. Following the Boomers is Gen(eration) X, defined here as those born during the “Baby Bust” from 1965-1982, who grew up without the Internet but were young enough to readily incorporate it into their lives. As young adults, Gen Xers experienced the September 11 attacks and in midlife faced the Great Recession. Millennials, defined as those born 1983-1997, are largely the children of Baby Boomers and are the “Echo Boom,” being more numerous than Gen X. The oldest Millennials came of age at the start of the War on Terror and the cohort was most affected by the Great Recession. Finally, Gen(eration) Z, born in 1998 or later, grew up with smartphones and have experienced the COVID-19 pandemic at a formative age.
Though these generational groups reflect national-level social and cultural events, they connect to specific processes in Georgia, as well. Before World War II, Georgia received very little in-migration, and population growth was mostly due to domestic birth rates. Beginning in the 1960s, Georgia saw increasing migration from other areas of the United States, particularly in the Atlanta metro (Meade, Reference Meade1972). By the 1980s, Georgia was one of the top destinations for interstate migration along with other Southern states (Frey, Reference Frey1995), and the Atlanta metro remains one of the fastest-growing in the United States. These population movements mean that Georgia speakers growing up before the 1960s (i.e., pre-Baby Boomers) interacted mostly with Georgia-born speakers in adolescence compared to those born later. The Baby Boomer generation saw the beginnings of mass in-migration to Georgia, and the linguistic reality for later generations has become even more heterogeneous, similar to other Southern cities (Dodsworth & Benton, Reference Dodsworth and Benton2019). These demographic transitions in Georgia correspond to the generational codes we employ, so we expect linguistic features to shift in tandem.
Development and change of vowel systems in White Georgia speakers
Drawing on literature from dialectology, sociolinguistics, and sociophonetics, we make three points regarding English spoken by White Georgians. First, during the twentieth century, adult speakers participated in the SVS, and we describe their participation in more detail. Second, across several studies that make intergenerational comparisons, there is evidence of heightened SVS participation among Baby Boomers, especially for face/dress swapping. Finally, we discuss the LBMS among young speakers in Georgia.
The SVS is believed to have taken root in the late nineteenth century. The earliest aspects of the shift, including glide weakening in price, may have been local features that spread following the end of plantation-based agriculture, which triggered migration within and from the South (Thomas, Reference Thomas and Schneider2004). The twentieth century brought fronting of /oʊ/ (/u/-fronting is older), particularly after World War II, and centralization of face (Thomas, Reference Thomas and Schneider2004). Although we lack detailed descriptions of the SVS's spread in Georgia, several accounts confirm its presence among Georgians born in the late 1800s through 1945. Thomas (Reference Thomas2001) analyzed the individual vowel spaces of several speakers from Georgia, using interviews from the Linguistic Atlas of the Gulf States (LAGS; Pederson, McDaniel, & Adams, Reference Pederson, McDaniel and Adams1986). A female speaker (b. 1890) from Moultrie, Georgia, in the rural southern Plains, exhibited largely monophthongal /aɪ/, diphthongal /ɛ, æ:/, and a lowered nucleus for /eɪ/. Elsewhere in southeast Georgia, analyses showed that face/dress were strongly overlapped or reversed for two White Georgia speakers, born in 1902 and 1956; among the same speakers, glide weakening in /aɪ/ was variable, with the flattest F2 trajectories in presonorant position, and steepest trajectories before voiceless obstruents (Renwick & Stanley, Reference Renwick and Stanley2017), consistent with phonological descriptions. Evidence for the SVS in Georgia is also found in metro Atlanta, despite the city's status as “an exception to the predominant linguistic pattern of the South” (Labov et al., Reference Labov, Ash and Boberg2006:261). Among twelve speakers in Roswell, Andres and Votta (Reference Andres, Votta, Thomas and Yaeger-Dror2009) found that although many speakers had some SVS features, none showed all three stages; but there was “swapping” of face and dress among younger metro-Atlanta speakers. In Atlanta, Prichard (Reference Prichard2010) reported on the SVS in interview data with five speakers. She confirmed that all had some degree of face/dress “reversal.” On the other hand, the young Gen X speaker illustrating Atlanta in ANAE displayed few core SVS features, though he had the pin/pen merger and /Tuw/ fronting (Labov et al., Reference Labov, Ash and Boberg2006:Figure 18.15).
While no study of Georgia English has focused on the Baby Boomer generation specifically, several have included speakers from this group, and analyses suggest that speakers born in the mid-twentieth century exhibit strong Southern shifting. In a study of ten LAGS speakers from southeastern Georgia, Renwick and Olsen (Reference Renwick and Olsen2016) showed that the oldest speaker (b. 1894) exhibited little evidence of the SVS, while the youngest (b. 1954) reached the SVS's penultimate stage. In rural Griffin, Georgia, McNair (Reference McNair2005:61) found a potential Boomer peak in the SVS: middle-aged men had markedly higher rates of shifting among fleece/kit and face/dress. A similar pattern was suggested in Atlanta. Although Prichard interviewed only one Baby Boomer, she noted that “the most advanced speaker [with regard to the SVS] is the 56-year-old, whose high front vowel system […] shows complete reversal of [face] and [dress]” (Reference Prichard2010:146).
In the late twentieth century, younger White speakers have shifted away from Southern speech in Georgia. White Gen X and Millennial speakers are observed to show a more diphthongal price vowel (Prichard, Reference Prichard2010) and less Southern-shifted face and dress vowels (Andres & Votta, Reference Andres, Votta, Thomas and Yaeger-Dror2009:94), even among rural speakers (McNair, Reference McNair2005). In Georgia, younger Millennial and Gen Z speakers exhibit the LBMS, defined by retraction and lowering of the front lax vowels to a greater degree than older speakers. In a comparison of DASS (The Digital Archive of Southern Speech) “legacy” speakers against recent undergraduates at the University of Georgia, Stanley (Reference Stanley2022a) found a greater degree of diphthongization for price in the latter group. The trajectories of face/dress overlapped for DASS speakers, but were highly distinct in Millennials, with peripheral face and retracted dress. The use of retracted trap among Millennials confirmed their adoption of the LBMS, in the first description of this vowel system within Georgia.
To summarize, existing literature captures both the SVS among older White Georgians and the arrival of the LBMS among their younger counterparts. Meanwhile, evidence from outside Georgia—in urban centers of Michigan and North Carolina—suggests that regional varieties peaked, and then subsided, in those age groups. We extend this analysis to Georgia, and hypothesize specifically that in the front vowels, features of the SVS are strongest among Baby Boomers and “weaken” in later generations, with some younger speakers lowering and retracting the front lax vowels toward LBMS positions. Our testing ground is a large compilation of data from across Georgia, described in the next section.
Data
Datasets
We bring together data from five different sources: three legacy collections and two collections of recent recordings, including seventy-four women and sixty-one men (135 total).Footnote 2 All speakers in the analysis are White, both to allow for comparison with previous research on regional features in the South and to make analysis statistically tractable. Analysis of the vowel systems of Black speakers in these collections is ongoing (for initial results, see Renwick et al., Reference Renwick, Forrest, Glass and Stanley2022).
Our oldest recordings come from DASS (Kretzschmar, Bounds, Hettel, Pederson, Juuso, Oppas-Hänninen, & Seppänen, Reference Kretzschmar, Bounds, Hettel, Pederson, Juuso, Opas-Hänninen and Seppänen2013), a set of sixty-four interviews selected as a representative subset of LAGS (Pederson et al., Reference Pederson, McDaniel and Adams1986). LAGS was gathered by the Linguistic Atlas Project (LAP) from 1968 to 1983 across eight Southern states. Over 1,100 speakers were recorded, 242 in Georgia. Of these, thirteen White speakers’ interviews have been manually transcribed and force-aligned (Kretzschmar, Renwick, Lipani, Olsen, Olsen, Shi, & Stanley, Reference Kretzschmar, Renwick, Lipani, Olsen, Olsen, Shi and Stanley2019; Olsen, Olsen, Stanley, Renwick, & Kretzschmar, Reference Olsen, Olsen, Stanley, Renwick and Kretzschmar2017; Renwick & Olsen, Reference Renwick and Olsen2017). The speakers hail from across Georgia: Atlanta and the Piedmont, South Georgia, and the eastern coast, and were born from 1887 to 1956. Reel-to-reel tape data was digitized to .wav format by the LAP at the University of Georgia. Recordings in Roswell, Georgia, were collected within the Roswell Voices Project, largely in 2003 and 2006 (Kretzschmar, Reference Kretzschmar, Corrigan and Mearns2016; Kretzschmar, Andres, Votta, & Johnson, Reference Kretzschmar, Andres, Votta and Johnson2006; Kretzschmar, Lanehart, Anderson, & Childs, Reference Kretzschmar, Lanehart, Anderson and Childs2004). This corpus includes oral history interviews and word lists with long-term residents of Roswell, Georgia, an urbanizing “exurb” of Atlanta (Andres & Votta, Reference Andres, Votta, Thomas and Yaeger-Dror2009). We analyze nineteen speakers here, born 1905-1983. Cassette tape recordings were converted to .wav format by the LAP. The Atlanta Speech Project (Kretzschmar, Reference Kretzschmar and Lanehart2015; Kretzschmar, Lanehart, Barry, Osiapem, & Kim, Reference Kretzschmar, Lanehart, Barry, Osiapem and Kim2004) contains word lists and hour-long sociolinguistic interviews with people living in Fulton and DeKalb Counties in the Atlanta metropolitan area. They were gathered in 2003, and we analyze seven White speakers here, born 1934-1975. Interviews were recorded on cassette tape and converted to .wav format by the LAP. One dataset targets Millennial students at the University of Georgia (Stanley, Reference Stanley2022a). Recorded in 2017 in a sound booth, each participant read three hundred sentences (mean length = fourteen words) pulled from the Corpus of Contemporary American English (Davies, Reference Davies2008). Data are available from six speakers, born from 1994-1996, from across Georgia, including suburban Atlanta (Alpharetta, Snellville, Cumming), Savannah, and central Georgia (Byron, Statesboro). Audio was directly recorded to .wav format using Audacity. The final dataset includes Gen Z speakers who grew up in Georgia, mostly in the wider Atlanta Metropolitan Area, and studied at the Georgia Institute of Technology, recruited through a Psychology subject pool and as an extra credit option in linguistics courses. Each speaker records a thirty-minute sociolinguistic interview, and a two-minute reading passage; data are encoded as .wav files, using a Zoom recorder and lavalier microphone in a researcher's office. Speakers also complete an Internet survey about their demographic background and political orientation. We analyze ninety White speakers, born 1996-2003.
Our datasets combine recordings gathered across more than fifty years and are diverse in the topics discussed, the relationship between interviewer and interviewee, the number of speakers, amount of speech per speaker, style, and recording quality. Furthermore, our sample of speakers is not balanced for demographic characteristics, including the factors we address here (age, gender, education level), but also where in Georgia they come from. Where our mixed-effects models support it, we build in a statistical term to control for differences across collections.
Speakers selected for analysis
The dataset includes seventy-four women and sixty-one men whose birth years span over 110 years. The distribution of speakers across American generational cohorts is visualized in Figure 2. The border between the Lost and G.I. Generations is typically set at 1900 (Strauss & Howe, Reference Strauss and Howe1991); however, we have a gap in birth years from 1906 through 1915, so we extend the Lost Generation to 1907 for the purposes of our analysis. Additionally, Gen Z extends past 2003, but this is the latest birth year represented here.
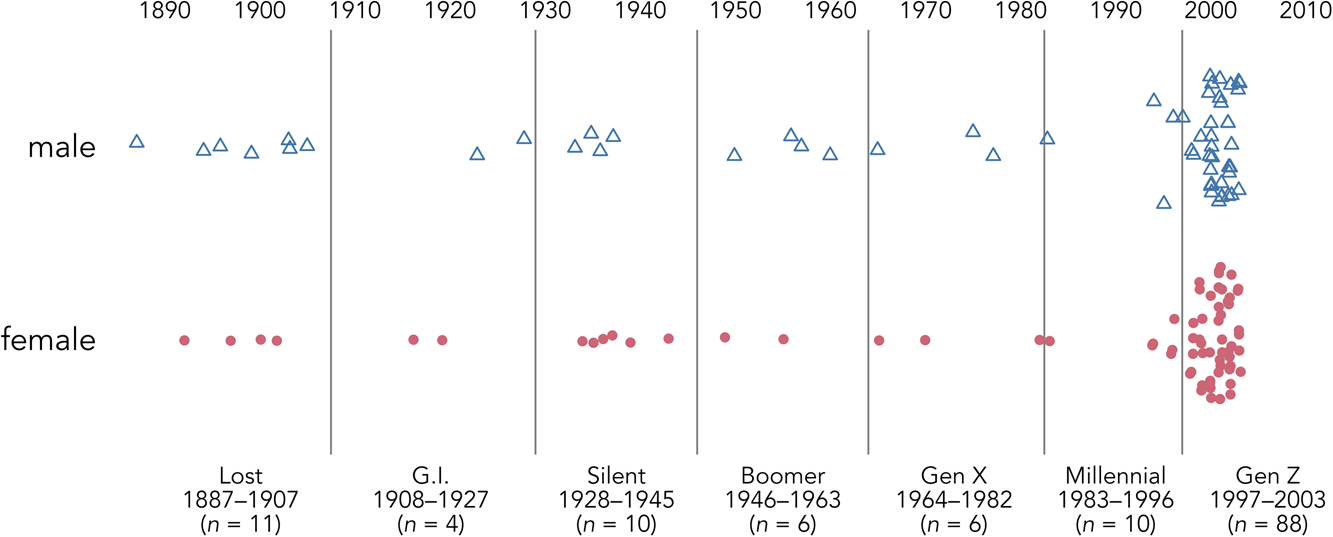
Figure 2. Speakers included in this study, separated by gender and arranged by generation (oldest to youngest), including number of speakers per generation (n). Points are jittered vertically. Although our generational labels match standard terminology, some generational divisions have been adjusted for our dataset.
Beyond gender and generation, our sample can be stratified by other social factors that may affect speakers’ adherence to local speech patterns like the SVS. Previous research has shown that socioeconomic status (SES) moderates use of SVS features to some degree, with lower-SES speakers using more SVS-shifted vowel realizations (Dodsworth & Benton, Reference Dodsworth and Benton2019; Fridland, Reference Fridland2001). We do not have SES data for all speakers; instead, as a proxy, we coded each speaker by the highest level of education they had either attained or were working toward at time of recording. Among the 135 speakers analyzed here, five had maximally attained an Elementary School education (0-7 years); six a Middle School education (maximum ten years); eight a High School education (11-12 years); four a Technical School degree; 111 had earned, or were in the process of earning, a Bachelor's degree (13-16 years); and one a Master's degree (16+ years). These six levels were subsequently collapsed into two: College (Bachelor's degree or higher) and No College (Elementary School through Technical School). Although a technical degree certainly constitutes higher education, we code it as “No College” due to the large sociocultural divide surrounding Bachelor's degree attainment. Additionally, Technical School graduates pattern similarly to speakers with No College degree for other sociolinguistic variables in the South (Forrest, Reference Forrest2015). Table 1 separates our speaker sample based on binarized education level, which is not uniform across the generations represented in our dataset. As we lack “No College” speakers in the youngest generations, we cannot include education in all statistical models, but we explore supplemental linear models controlling for it.
Table 1. Maximum education level of speakers, separated by generation

The characteristics of our speaker sample guide our analysis. As noted by the ANAE, Georgians typically do not reach Stage 3 of the Southern Shift (see McNair, Reference McNair2005), in which fleece and kit are “reversed,” with a centralized tense vowel and a diphthongized lax vowel. Instead, most adult Georgians show some degree of glide weakening in price, accompanied by centralization of face and diphthongization of lax dress. In the Piedmont area of northern Georgia, which includes Atlanta, Thomas (Reference Thomas2001) noted that /aɪ/ remains diphthongal before voiceless consonants (e.g., in the word price). Most speakers in our sample are from the Piedmont, so we expect monophthongization of price only outside of pre-voiceless contexts, and shifting in the high front vowels should be minimal if present at all. Consequently, we do not analyze fleece, kit, or pre-voiceless price, although they are implicated in some SVS-shifted varieties. The front vowels we consider are the pre-voiced or final allophones of /aɪ/, which we label prize or pry; mid-tense face, its lax counterpart dress, and the low lax vowel trap; as our younger speakers may exhibit the LBMS, we analyze back vowels lot and thought.
Methods
Transcription and forced alignment
In all five collections, interviewee speech was transcribed at the lexical level. For speakers from LAGS/DASS, transcription was manual and checked for errors up to four times (see pipeline in Olsen et al., Reference Olsen, Olsen, Stanley, Renwick and Kretzschmar2017). Forced alignment was done using the Montreal Forced Aligner (MFA; McAuliffe, Socolof, Mihuc, Wagner, & Sonderegger, Reference McAuliffe, Socolof, Mihuc, Wagner and Sonderegger2017), which is estimated to have a word-level accuracy rate of 86% for this data (Stanley et al., Reference Stanley, Renwick, Margaret E. L., Ireland and Olsen2021:398). Formant values and other acoustic measurements were extracted at five time points (20%, 35%, 50%, 65%, 80% of vowel duration) using a local installation of the FAVE suite (Rosenfelder, Fruehwald, Evanini, Seyfarth, Gorman, Prichard, & Yuan, Reference Rosenfelder, Fruehwald, Evanini, Seyfarth, Gorman, Prichard and Yuan2014).
Transcriptions for the Roswell Voices Project were conducted manually in ELAN (ELAN, 2022; Wittenburg, Brugman, Russel, Klassmann, & Sloetjes, Reference Wittenburg, Brugman, Russel, Klassmann and Sloetjes2006)Footnote 3 and exported to TextGrid format (Boersma & Weenink, Reference Boersma and Weenink2017). Transcriptions of the Atlanta Speech Project were conducted manually in Praat, sometimes with the assistance of CLOx (see endnote 3). For the Roswell and Atlanta collections, forced alignment was done either using a local installation of MFA, or with DARLA's implementation of MFA. Acoustic measurements were made using DARLA (Reddy & Stanford, Reference Reddy and Stanford2015), whose formant extraction uses FAVE-extract. DARLA did not filter the data based on stopword status or formant bandwidth.
The University of Georgia reading passages (Stanley, Reference Stanley2022a) were manually transcribed using Praat. Forced alignment and formant extraction were done using the DARLA suite, without filtering. The Georgia Tech interviews were manually transcribed (see endnote 3). Transcriptions were submitted to DARLA for forced alignment and vowel extraction, using the Semi-Automated method. DARLA's default filtering settings were used, resulting in the exclusion by DARLA of stopwords and words with high formant bandwidths. While this method is different from the no-filtering method described above, it has been argued (Marinaccio, Shapp, & Singler, Reference Marinaccio, Shapp and Singler2021) that bandwidth filtration is not harmful to the evaluation of individual vowel spaces.
Data processing
Data processing was conducted in R, following the order of operations recommended by Stanley (Reference Stanley2022b). We kept only vowel tokens having complete F1, F2 trajectories (ten defined measurements total). Stopwords were removed using the “marimo” list from the stopwords package (Benoit, Muhr, & Watanabe, Reference Benoit, Muhr and Watanabe2021). Data were normalized per speaker using the log-means method proposed by Barreda and Nearey (Reference Barreda and Nearey2018; see Barreda, Reference Barreda2021). We eliminated tokens preceding sonorant consonants (i.e., nasals, laterals, and rhotics). The dataset was narrowed to six phonological vowels. Due to the restrictions on tokens’ phonological context, we deviate from Wells’ (Reference Wells1982) lexical set labels in our analysis and refer to our subsets as allophones. Vowels analyzed are: /aɪ/, divided into the allophones prize (/aɪ/ preceding voiced obstruents) and pry (/aɪ/ in final position); /eɪ/, referred to in our dataset and results as bait; the lax vowels /ɛ/ (bet) and /æ/ (bat); the back vowels /ɔ/ (bought) and /ɑ/ (bot). The total number of tokens available for analysis, per allophone and speaker gender, across all data collections is shown in Table 2.
Table 2. Total tokens analyzed, per speaker gender

We also calculated vowels’ positions along the front-vowel diagonal such that higher values indicate a position higher and fronter in the vowel space (Labov et al., Reference Labov, Rosenfelder and Fruehwald2013). Following Dodsworth and Benton (Reference Dodsworth and Benton2017) we calculate this value as normalized (F2 – F1).Footnote 4 For front vowels, diagonal positions were calculated using measurements taken at 35% of vowel duration, approximating the vowel nucleus. For prize and pry, we used measurements from 80% of vowel duration, representing the offglide. Eighty percent was chosen as the offglide measurement point both to align with recent trajectory-based analyses (Farrington et al., Reference Farrington, Kendall and Fridland2018) and to identify a point late enough in the vowel duration where any diphthongal movement, no matter how minimal, would be captured. bot and bought are not front vowels, and the (F2 – F1) measurement is not obviously indicative of their position, so they are not analyzed in this way.
Generalized additive mixed modeling
The application of GAMMs (Wood, Reference Wood2017a) to vowel trajectories is rooted in the finding that vowel-inherent spectral change is perceptually important for speech decoding (Hillenbrand, Getty, Clark, & Wheeler, Reference Hillenbrand, Getty, Clark and Wheeler1995). Dynamic qualities of vowels vary regionally within the US (Farrington et al., Reference Farrington, Kendall and Fridland2018; Fox & Jacewicz, Reference Fox and Jacewicz2009) in ways that are rendered visible with GAMM output (see Renwick & Stanley, Reference Renwick and Stanley2020 for further discussion).
We built a separate GAMM for each combination of allophone, gender, and formant, leading to twenty-eight separate models. The dependent variable was log-means normalized formant values, from five measurement points per token. The models’ independent variables included a nonlinear, continuous smooth term for speaker year of birth (YoB), and a smooth term for measurement point (percent), ordered 20% to 80%. Smooths used four knots. The two smooths were combined into a tensor-product interaction allowing the predicted trajectory to freely vary in shape across YoB. Vowel duration was included as a parametric effect. The random effects structure comprised linear random intercepts and slopes for speaker, word, and collection. Model specifications and summaries appear in Appendix 1. Models were fitted using the mgcv::bam() function in R (Wood, Reference Wood2017b).
We evaluate the GAMMs in two ways: first, via visualizations of predicted measurements, which were extracted from each model. Second, we tested the significance of YoB via model comparison (Renwick & Stanley, Reference Renwick and Stanley2020; Stanley et al., Reference Stanley, Renwick, Margaret E. L., Ireland and Olsen2021). For each GAMM, we constructed a model that excluded YoB but was otherwise identical. Each “dropped” model was evaluated against its “full” equivalent via itsadug::compareML() (van Rij, Wieling, Baayen, & van Rijn, Reference Van Rij, Wieling, Baayen and van Rijn2017), which returns a score and p-value through chi-squared testing of log-likelihood. If the “full” model including birth year is deemed to be significantly better (p < 0.05) than the “dropped” version without birth year, we infer that the shape and/or position of that vowel's trajectory is meaningfully predicted by speaker year of birth.
Linear mixed modeling
Turning to the front diagonal, we treated each SVS-implicated allophone with a linear mixed-effects model. The dependent variable was the vowel diagonal value. Factors were treatment coded. Generation was a categorical variable with seven levels: Lost, G.I., Silent, Boomer (reference), Gen X, Millennial, Gen Z. Gender was also a categorical predictor, with “Women” as reference level versus “Men.”Footnote 5 Vowel duration was a continuous fixed effect. Random intercepts were included for speaker and word. Models of greater complexity, including a random intercept for collection, did not converge for all allophones. Models were fitted using the lme4::lmer() function (Bates & Maechler, Reference Bates and Maechler2009) with the bobyqa optimizer, plus the lmerTest package (Kuznetsova, Brockhoff, & Christensen, Reference Kuznetsova, Brockhoff and Christensen2013).
We formulated allophone-specific hypotheses prior to modeling. For /eɪ/ in bait, we hypothesized the lowest values would occur among Boomers, with higher positions along the diagonal for all other generations. For /ɛ/ in bet, we hypothesized Boomers would have the highest position along the diagonal, and we anticipated the lowest values for Gen Z. For /æ/ in bat, we hypothesized that Gen Z would show the lowest positions along the front-vowel diagonal, and that it would be higher among Boomers. For prize and pry, we hypothesized that Boomers would have the lowest realizations and that other generations’ would be higher, particularly among the younger speakers.
Results
GAMMs
Model comparisons confirmed that for all models save one (F2 of pry, for women) the inclusion of YoB provided a significant improvement in fit over an identical GAMM lacking that term.Footnote 6 For all allophones (including women's pry, whose F1 model is improved by YoB), there is significant variation in trajectory shape and/or vowel space position across time.
We visualize full vowel trajectories using predicted values that represent birth years at the midpoints of six generations. Women's and men's GAMMs are visualized separately, and we note that, generally, women lead the changes described here; however, differences between genders are comparatively small. Figure 3 shows predicted trajectories for speakers born in 1900 (left), representing the Lost Generation, and 1918 (right), from the G.I. Generation. For both ages, bot and bought are distinct, with bot having a higher F2, and bought a longer, backing trajectory. prize is more fronted than pry, particularly at its onset. bat's short trajectory moves forward and higher over its time course. bet has similar F2 values to bat. For Lost Generation speakers, bait's onset is higher and fronter than bet, while for G.I. speakers, bait's onset has centralized and bet has raised, so bet's trajectory overlaps bet. This indicates that face-dress swapping has arrived, but the vowels are not (yet) fully swapped. Trajectories of bait reach a more peripheral point among G.I. speakers than Lost Generation speakers.
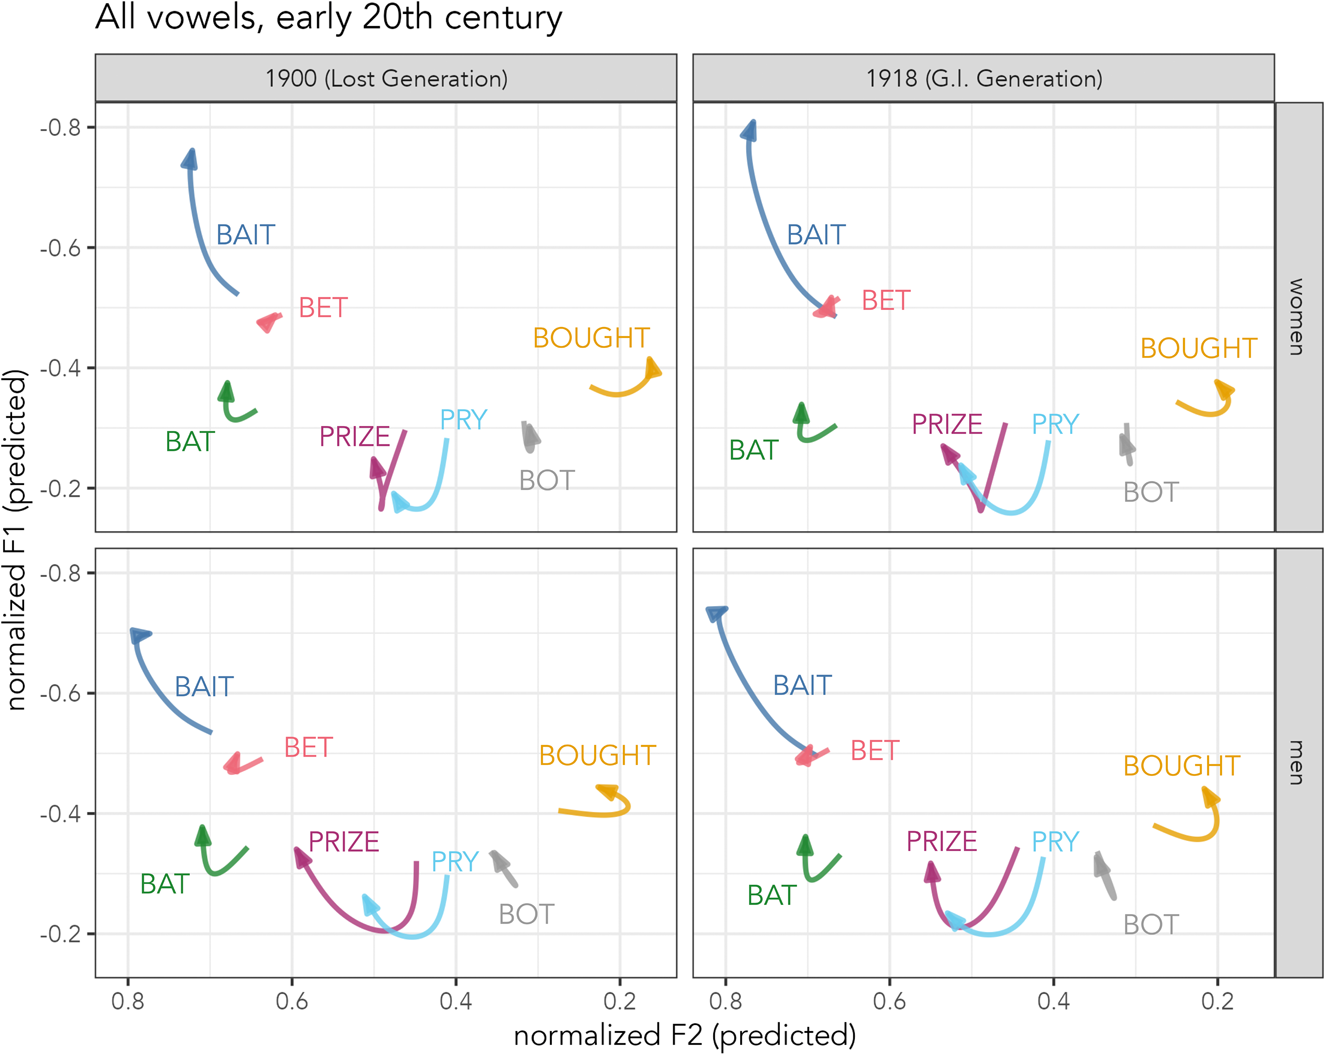
Figure 3. Front-vowel spaces for speakers born in the early twentieth century, compiled from GAMMs’ predicted values at 20%-80% duration. Left: speakers born in 1900; right: speakers born in 1918. Top: women; bottom: men.
In Figure 4, predicted trajectories are shown for speakers born in 1937 (left) and 1955 (right), representing the Silent and Baby Boomer generations. Silent Generation speakers have shorter /aɪ/ trajectories than Boomers, which suggests that /aɪ/ glide weakening may have begun receding among Baby Boomers. bot and bought are distinct but approximated with respect to the oldest speakers: in Figure 4, bought lowers toward bot. bat maintains a relatively short trajectory, indicating a largely monophthongal realization. In the Silent Generation, bet's trajectory overlaps and crosses bait's onset, indicating swapping. In Baby Boomers, the trajectories of bait and bet begin to separate but still overlap in F1. These results suggest that two key features of the SVS—glide weakening in /aɪ/ and swapping of face/dress—had just begun to recede in Georgia by 1955, in the Baby Boomer generation.
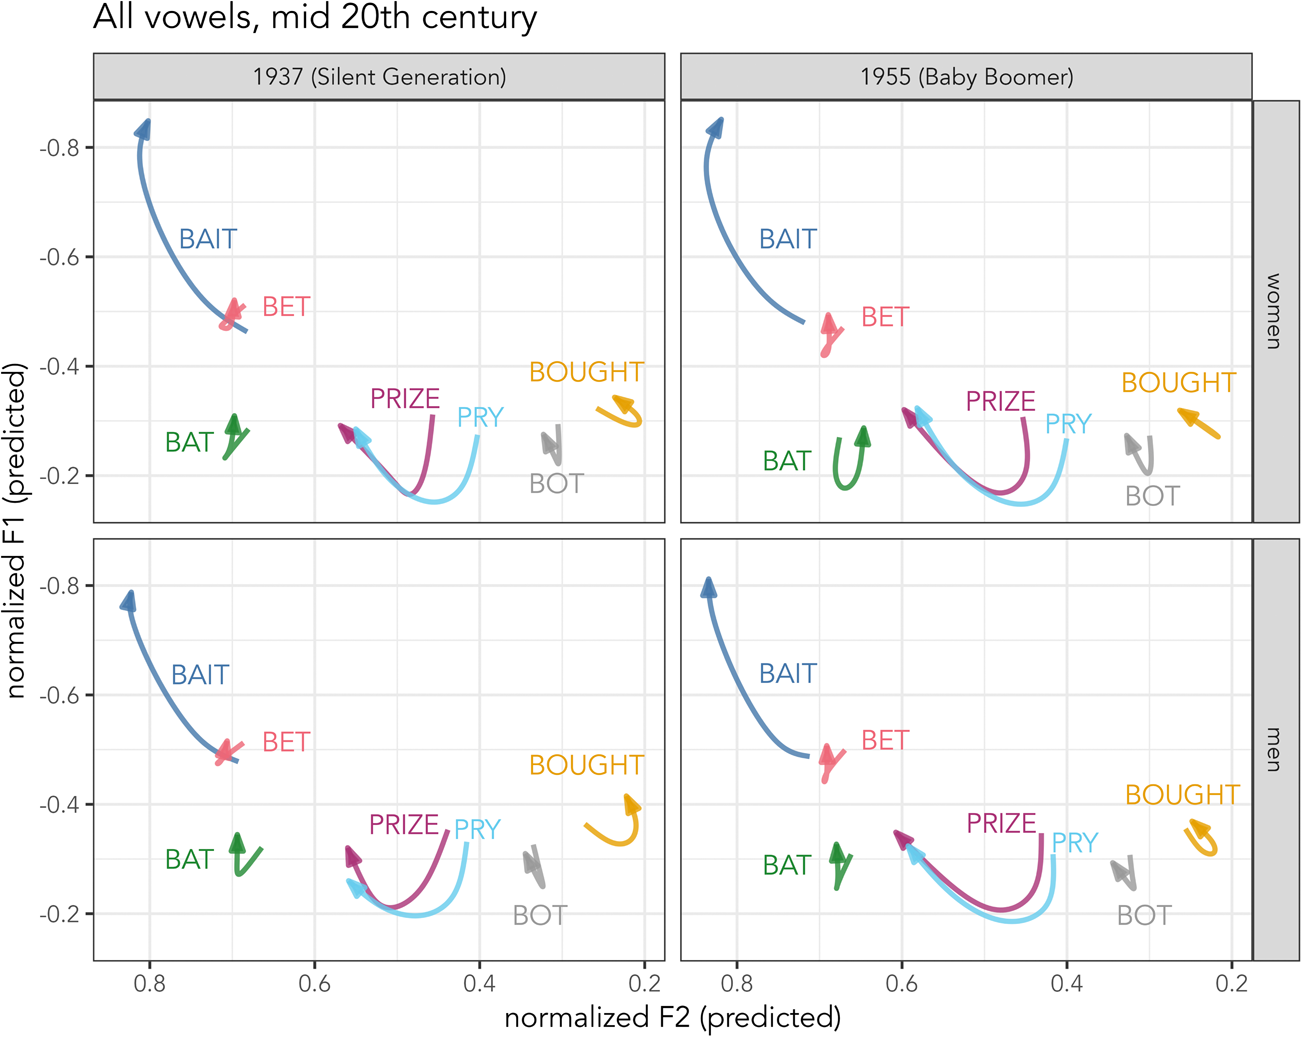
Figure 4. Front-vowel spaces for speakers born in the mid twentieth century, compiled from GAMMs’ predicted values at 20%-80% duration. Left: speakers born in 1937; right: speakers born in 1955. Top: women; bottom: men.
Young Georgians’ trajectories are modeled in Figure 5, including birth years 1974 (left) and 2000 (right), representing Gen X and Gen Z. The vowel systems shown here are markedly different from older speakers’. For all groups, the /aɪ/ allophones’ offset has a lower F1 than bat, indicating its trajectory lengthening. bought remains slightly backer than bot, although they have similar ingliding trajectories. The lax front vowels have shifted. bat is ingliding and retracted, while bet is lower in Gen Z compared to Gen X. bait is very peripheral, especially in Gen Z, compared to the other front vowels, with a lower F1 and higher F2 throughout its trajectory. bait and bet are very distinct, and their trajectories do not cross; there is no face/dress swapping for these speakers. These effects are stronger for Gen Z than for Gen X. The picture shown for late twentieth century Georgians is not the SVS; instead, the Gen X speakers show a retreat from the SVS, characterized by retracting front lax vowels, which is consistent with the LBMS among younger, Gen Z speakers.

Figure 5. Front-vowel spaces for speakers born in the late twentieth century, compiled from GAMMs’ predicted values at 20%-80% duration. Left: speakers born in 1974; right: speakers born in 2000. Top: women; bottom: men.
Linear models
We next evaluate allophones’ positions along the front-vowel diagonal. We hypothesized that Baby Boomers (born 1946-1963) would show the strongest SVS adherence, tested by setting that generation as the reference level. Our hypotheses are supported if, for each allophone, the model coefficients associated with Generation are significant (p < 0.05) for levels representing speakers both older and younger than the Boomers. We also examine the sign of these coefficients: a positive coefficient indicates a higher, fronter vowel with respect to Boomers, while a negative coefficient indicates a lower, more retracted vowel. Model summaries for the five mixed-effects models are available in Appendix 2.
The model coefficients for fixed effects appear in Figure 6. The reference level of Boomer women is represented by a black dot at X = 0, and generations are arranged vertically from oldest to youngest. The results provide partial support for our hypotheses. For bait, Boomers have the most retracted vowel, and younger speakers have the most peripheral vowel. This difference is significant for Boomer versus all levels except G.I. and Silent. Turning to bet, the Silent Generation's vowel is significantly more raised than Boomers’ (p < 0.01), while younger generations have a lower bet consistent with the onset of the LBMS. The difference with respect to Boomers’ bet is small but significant (p < 0.05) for Gen X and Millennials, while for Gen Z the difference is greater (β = –0.19, p < 0.001). For bat, there is continual change across generations, but older generations have a raised vowel compared to Boomers, while younger generations have a lowered vowel. The difference is significant for Boomers versus Millennials (p < 0.01) and Gen Z (p < 0.001). In both /aɪ/ allophones prize and pry, examined at 80% duration, older generations have slightly more retracted offsets than Boomers. There is statistically significant raising of the /aɪ/ offglide along the diagonal in younger speakers, consistent with a shift toward the diphthongal realization.
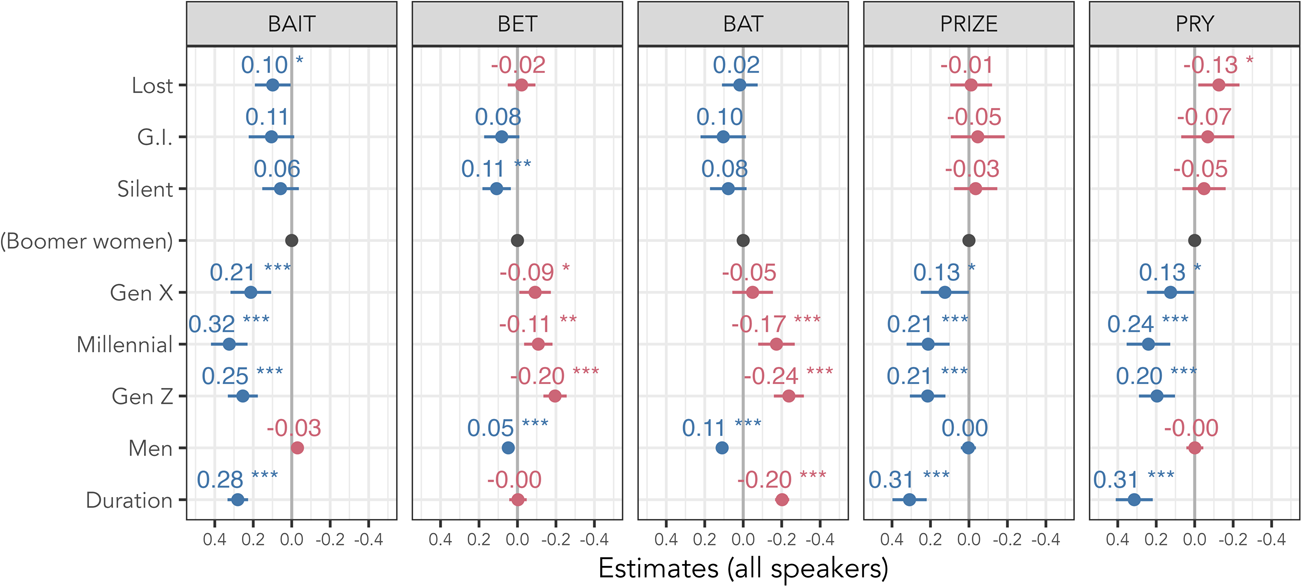
Figure 6. Model coefficients with 95% confidence interval (all speakers). Stars indicate significance level: * = p < 0.05; ** = p < 0.01; *** = p < 0.001. Reference level for Generation (Intercept) is indicated as a black dot. The x-axis is inverted so that higher/fronter vowel realizations are plotted toward the left.
Education level
It is possible that these changes are driven in part by the fact that our younger speakers all attended college, while many of our older speakers did not. To control for education while exploring the effects of age, we created two supplemental linear mixed-effects regression models. We first applied the same model structure as in Figure 6 to only College-educated speakers (see Table 1). The model results are summarized in Figure 7. Although some significance levels change with respect to Figure 6, the pattern of vowel placements along the diagonal is quite similar when we consider only College-educated speakers compared to our entire pool. In post-Boomer generations, all vowels change away from SVS positions relative to the Boomer reference level. Loss of significant differences—for Gen X prize and pry, for instance—is likely due to small token numbers. In another mixed-effects regression (not illustrated), we excluded all Millennial and Gen Z speakers, and included a binary predictor of Education (College versus No College). For all allophones tested, this Education factor did not significantly predict front-vowel diagonal position (p > 0.05).

Figure 7. Model coefficients with 95% confidence interval (speakers with college education). Stars indicate significance level: * = p < 0.05; ** = p < 0.01; *** = p < 0.001. Reference level for Generation (Intercept) is indicated as a black dot. The x-axis is inverted so that higher/fronter vowel realizations are plotted toward the left.
To summarize, the results of linear mixed-effects modeling show that older generations’ vowels are generally as shifted as Boomers’, suggesting that the SVS was largely in place across Georgia by the early twentieth century and was maintained through the mid twentieth century. In Georgia, the most advanced stage of the SVS is face/dress swapping. We find that the lax vowel implicated in this stage, bet, is most peripheral among Silent Generation speakers. However, tense bait is most retracted for (Silent and) Boomer speakers. This feature, therefore, arrived later than other features in Georgia and reached its peak with those born in the mid twentieth century. After the Baby Boomer generation, all five allophones shift rapidly away from SVS positions and eventually toward the LBMS, especially for Gen Z. This involves increased diphthongization for /aɪ/, retraction of the lax vowels, and peripheralization of /eɪ/. These results do not change when speakers’ education level is controlled for: older College-educated speakers adhere more to SVS positions than younger College-educated speakers do.
Discussion and conclusion
To interpret these results in context, we return to the metaphor in our title: Do our results suggest a “peak” of the SVS for Boomers or a precipitous “cliff” for Gen X? In the former case, the presence of a strong SVS would be more of an aberration in the larger historical picture, where Boomer speakers’ high degree of regional shifting was an exception. In the latter case, change toward the SVS may have gradually increased until the time of Boomer speakers, and the notable change is a subsequent sharp decline of longstanding features. Our results suggest a cliff for the SVS in Gen X, rather than an exceptional peak in Boomer speakers.
Patterns of change suggest stability for most vowels implicated in the SVS but a very stark change-in-progress for the SVS reversal. The proposed early stages of change in the SVS, like the monophthongization of prize and pry, have completed earlier than our dataset extends and remain steady among Baby Boomers. In contrast, we propose that the decline of all patterns implicated in the SVS points toward a change from above beginning in Gen X. Other studies have suggested something similar, positing the source as increased in-migration (Dodsworth & Benton, Reference Dodsworth and Benton2019; Dodsworth & Kohn, Reference Dodsworth and Kohn2012) combined with negative social connotations of the SVS (Dekker, Reference Dekker2018; Forrest, Reference Forrest2018; Fridland & Bartlett, Reference Fridland and Bartlett2006; Lide, Reference Lide2014). These are both likely contributors, but positing clear causal mechanisms is unreliable in our case due to the diversity of corpus sources and speaker backgrounds in our dataset.
This diversity of data sources also means that social characteristics not captured in our analysis may affect the generational changes we observed here. First, SES may moderate the retention of the SVS or the adoption of the LBMS in Georgia. Generational trends in our data are relatively consistent across educational groups, but the lack of any speakers without college degrees in the youngest generations may affect the rate at which we see vowel positions change. Previous work on Southern Englishes showed movement away from the SVS for all speakers, regardless of SES/occupation/education (Dodsworth & Benton, Reference Dodsworth and Benton2019; Forrest, McDonald, & Dodsworth, Reference Forrest, McDonald and Dodsworth2021), but any nuanced differences across these groups cannot be examined in our data. Second, differences in speakers’ place of origin within Georgia (e.g., rural/urban, population density) may affect generation-internal variability in vowel systems. Models of linguistic diffusion (Gordon, Reference Gordon2001; Trudgill, Reference Trudgill1974) would posit different rates of SVS loss or LBMS adoption in smaller population centers versus those found in a major metro area like Atlanta. However, previous work found the SVS in retreat in rural areas as well (Jacewicz, Fox, & Salmons, Reference Jacewicz, Fox and Salmons2011; Knight, Reference Knight2015), meaning that macrolevel changes over time are likely not affected by participants’ towns of origin to a worrying degree.
Finally, this analysis includes only White speakers, which precludes any comparison between groups or examination of ethnolectal features such as those implicated in the African American Vowel Shift (Farrington et al., Reference Farrington, King and Kohn2021; Thomas, Reference Thomas2007). It also obscures any role that Whiteness itself may play in the vowel system changes we see here, as there is growing acknowledgement of the intersectional complexity of race when analyzing the maintenance or disappearance of regional vernaculars (Becker, Reference Becker2014; King, Reference King2021). These questions become even more complex at increased time depth, due to factors including racialized demographic changes like the Great Migration or the more recent “Reverse” Great Migration to the South (Farrington, Reference Farrington2018; Farrington et al., Reference Farrington, King and Kohn2021; Hunt, Hunt, & Falk, Reference Hunt, Matthew O., Larry and Falk2012).
Our results make clear that, among White speakers from Georgia, the phonological vowel system has reorganized itself over the last fifty years. For the SVS, and most strikingly here for bait and bet, vowel dynamics are a key factor in preserving contrast (Farrington et al., Reference Farrington, Kendall and Fridland2018). For example, as seen in Figures 3–5, even where bait and bet overlap in the vowel space, they remain phonetically distinct due to their different formant trajectories. Further analysis of our growing Georgia collections should also include the dynamics of other vowels, particularly back or high front vowels, which have distinct regional configurations. By considering the whole vowel space as a system, with an additional dimension of vowel-inherent time, we can understand how distinctions are maintained between sounds and words.
In conclusion, this paper demonstrates that White Georgian speakers show maintenance of SVS features up to the Baby Boomer generation, with a sharp drop in their use from Gen X onward. Linear modeling shows a clear division between Boomer speakers and Gen X, with SVS features precipitously declining thereafter. Finally, the youngest Gen Z speakers show evidence of the LBMS. These findings have important implications for both the decline of mid-twentieth century regional vernaculars and the rise of the LBMS. As the LBMS becomes more established in other regions with longstanding regional systems (Nesbitt, Reference Nesbitt2021; Nesbitt & Stanford, Reference Nesbitt and Stanford2021), we can investigate whether such changes begin around Gen X, as we find here. If so, we have the opportunity to consider possible explanations for panregional change, which may shed light on the importance of processes like demographic shift or social evaluation as driving forces behind novel linguistic changes.
Supplementary material
To view supplementary material for this article, please visit https://doi.org/10.1017/S095439452300011X.
Acknowledgments
We tip our hats to Jim Stanford for suggesting a linguistic “cliff” in the late twentieth century. Thanks to the Language and Politics in the New South VIP team at Georgia Tech, particularly Marcus Ma for building transcription tools that leverage ASR. This research was supported by NSF BCS Grant No. 1625680.
Competing interests
The authors declare none.


 Open access